
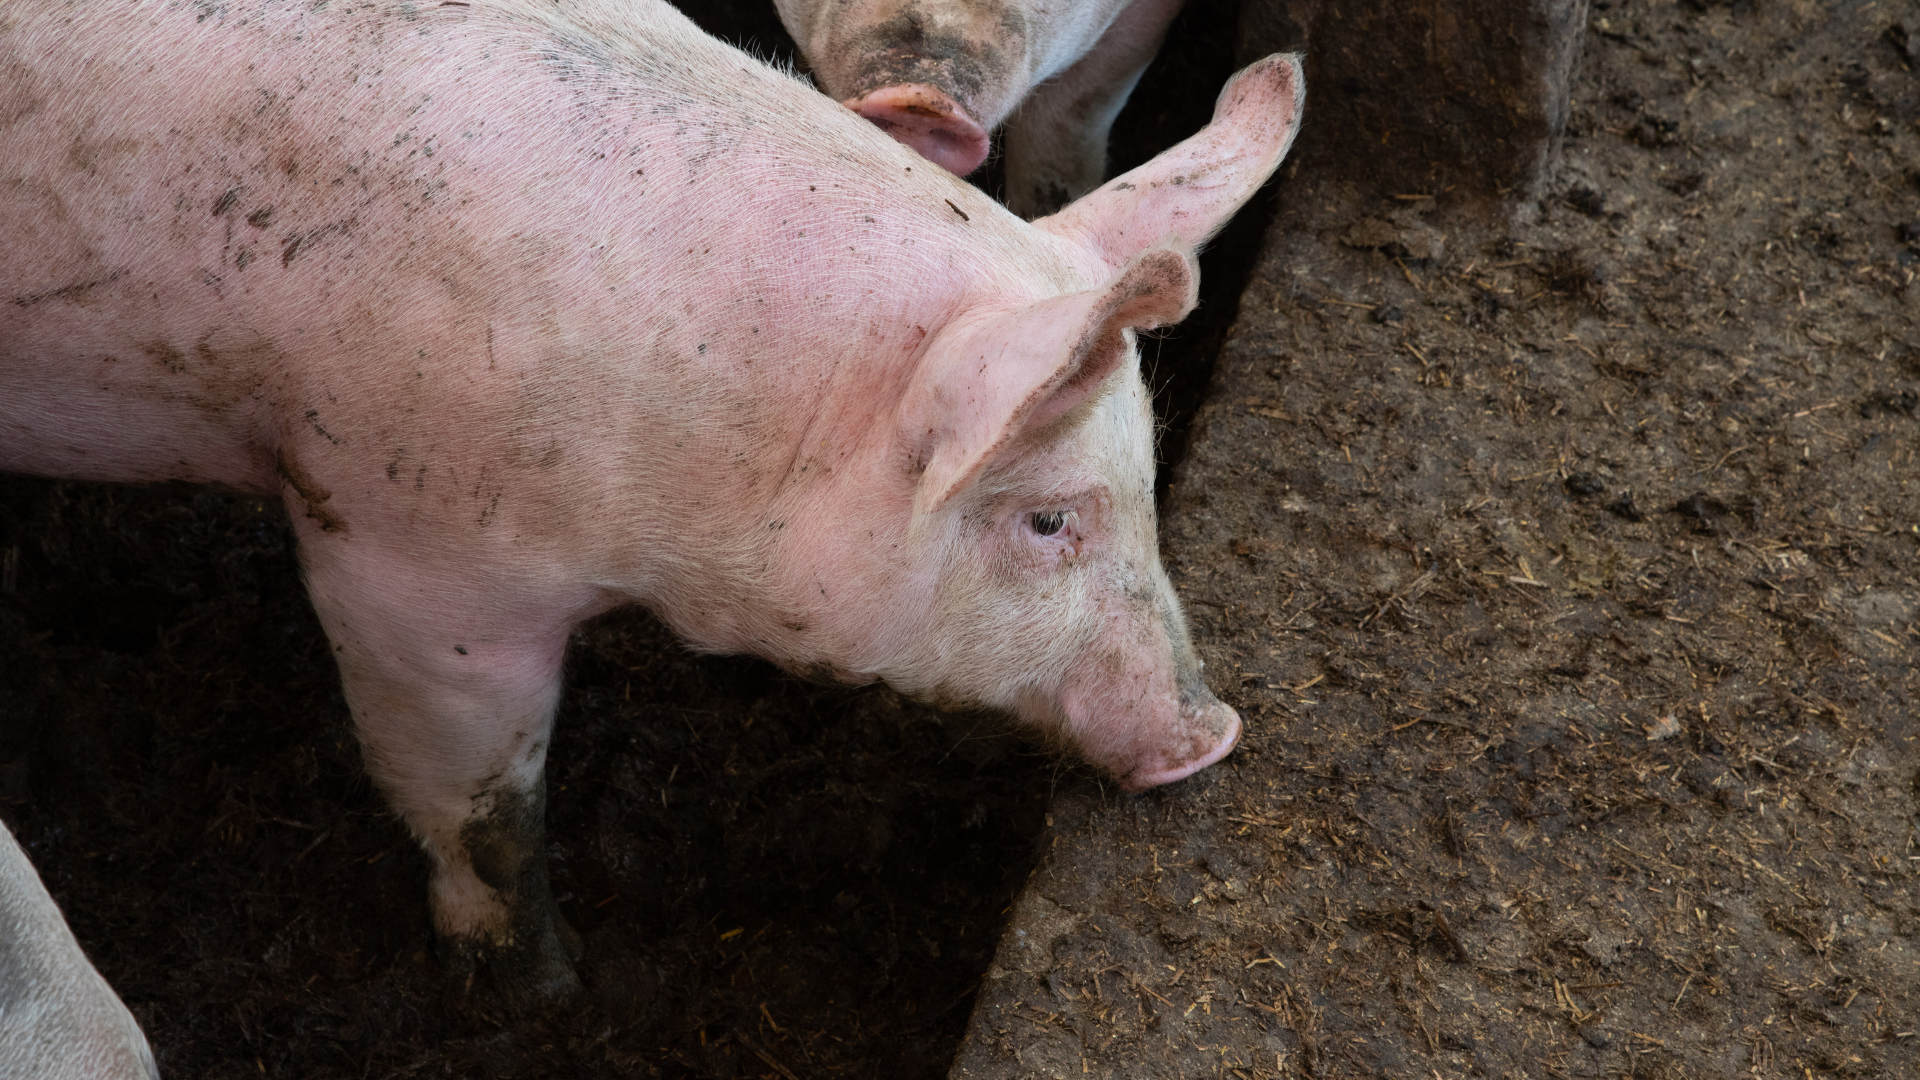
Slurry biogas carries three specific operational pains that do not appear with other substrates: a low energy load per unit of mass, free ammonia inhibition derived from the ammonia nitrogen in the manure, and the erratic entry of veterinary antibiotics and disinfectants that damage the methanogenic consortium.
The profitability of livestock biogas does not depend on how much slurry enters the digester, but on the capacity of the system to absorb those three sources of variability without decoupling.
Balanced co-digestion, free NH₃ monitoring and pharmacological traceability of the batch are the three operational levers.
Slurry biogas is usually sold as the simplest use case in anaerobic digestion: available substrate, an installation close to the point of generation, waste management and energy production solved at once.
The operational reality is the opposite.
A poorly designed slurry biogas plant has three structural causes of instability that do not appear with other substrates:
- Low methanogenic potential per unit of volume.
- High ammonia nitrogen concentration, which limits the real processable load.
- Intermittent exposure to antibiotics and disinfectants that come in with the natural flow of the livestock operation.
This article describes each of the three causes, the reference analytical ranges and the three operational levers that turn an unstable plant into a predictive control unit.
Why slurry biogas is operationally different
Slurry is water with dilute organic matter. The typical BMP of pig slurry sits between 180 and 280 NmL CH₄/g VS and that of cattle slurry between 150 and 240, well below the 290-340 of maize silage or the 350-450 of fruit and vegetable waste.
That difference is not the real difficulty. The real difficulty is that this modest BMP comes with an anomalously high total ammonia nitrogen (TAN) content.
In practice, when a plant tries to raise the organic loading rate to compensate for the low BMP, what rises first is not methane production: it is the TAN concentration in the digestate.
And when TAN rises, so does the free NH₃ fraction, according to the equilibrium with pH and temperature. That free fraction is what inhibits the system.
The second structural factor is variability at source. A pig farm changes the animal diet by season, alternates pharmacological treatments according to the age of the batch and applies periodic disinfections with biocides that end up in the slurry pit.
All that variability reaches the digester without any filter and without traceability, unless the plant has established an explicit protocol with the farm of origin.
Free ammonia inhibition: pig versus cattle slurry
The typical TAN of pig slurry sits between 3,000 and 5,500 mg N/L. That of cattle slurry, between 1,500 and 3,500 mg N/L.
That difference explains why digesters treating pig slurry enter the alert zone before those treating cattle slurry, even operating at the same nominal organic loading rate (OLR).
The real inhibiting fraction is not TAN, but free NH₃. It is calculated from TAN, pH and digester temperature, according to the equilibrium pKa = 9.25 at 35 °C. The calculation and the thresholds are detailed in free ammonia in biogas.
The reference thresholds:
- In a non-acclimated mesophilic consortium, 150 mg N-NH₃/L already causes incipient inhibition.
- Above 700 mg N-NH₃/L the process collapses, unless there has been prior acclimation.
- A consortium acclimated over 60-120 days can tolerate up to 1,000 mg N-NH₃/L, but acclimation requires gradual slurry entry and reinforced monitoring of FOS/TAC and individual VFAs.
The Smallops operational rule is to calculate free NH₃ weekly, not fortnightly or monthly.
Free NH₃ changes quickly with pH, and pH changes quickly with the animal diet at the farm of origin. A weekly measurement makes it possible to anticipate the decoupling between acidogenesis and methanogenesis 5-10 days before methane productivity reflects it.
Antibiotics and disinfectants: the invisible contaminant
Veterinary antibiotics enter the digester with the slurry without the plant knowing.
The operator does not control when the batch is medicated at the farm. A pig operation treats diarrhoea episodes with tylosin, neomycin or sulfonamides; a cattle operation treats mastitis with cephalosporins. The pharmacological residues reach the digester in a bolus, not in a constant flow.
The inhibition is selective: it does not affect all groups in the consortium equally. Published data show that tylosin inhibits methanogenesis above 50 mg/L in the digester, and glutaraldehyde (a very common farm disinfectant) above 100 mg/L.
Below those thresholds the effect is sublethal: it slows the kinetics without collapsing them, which translates into a drop in specific productivity with no explicit decoupling.
This is operationally deceptive. The plant sees FOS/TAC still in the stable zone and the biogas composition unchanged, but methane production per kilo of volatile solids fed drops by 8-15%.
Attributing that drop to biology without investigating the pharmacological traceability of the batch is the leading cause of misdiagnosis in slurry biogas plants.
The correct intervention is not chemical: it is contractual. It means establishing with the farm of origin a protocol for notifying pharmacological treatments, so the affected batch can be held during the excretion period (typically 5-10 days) before it goes to the digester.
Co-digestion: energy substrates to stabilise slurry
Slurry alone is not an economically viable substrate as an exclusive diet in most configurations. Its low BMP forces very high volumes to be moved to produce modest amounts of methane, and the high TAN concentration limits the fraction of the digester that can be devoted to it.
Agro-industrial co-digestion with energy substrates is the standard solution. But not all co-digestion is equivalent:
| Co-substrate | Typical BMP (NmL CH₄/g VS) | Contributes | Limitation |
|---|---|---|---|
| Maize silage | 290-340 | Stable energy load | Rising cost; competition with food use |
| FOG (fats) | 600-900 | Maximum energy in less volume | Risk of LCFA inhibition if the fraction exceeds 5-8% on VS |
| Fruit and vegetable waste | 350-450 | Cheap co-digestion | Strong seasonal variability; low pH |
| Crude glycerine | 800-1,000 | Concentrated energy | Sodium inhibition if it comes from unwashed biodiesel |
The Smallops operational ratio for pig slurry with an energy co-substrate is 60-75% slurry by volume and 25-40% co-substrate, with the specific fraction adjusted so that the overall diet results in an effective OLR of 60-80% of the digester nominal maximum.
Operating above 80% of the maximum OLR with slurry co-digestion means zero margin to absorb the seasonal variability of the farm, which is exactly the variability that has the greatest impact.
That co-substrate fraction is precisely what should be fixed in the laboratory before touching the plant. The BMP of each co-substrate tells you how much energy it contributes, but it is a batch test that measures the maximum potential under ideal conditions: it does not see accumulation. The semi-continuous test feeds a laboratory reactor continuously over several weeks, with the real mixture and retention time, and reveals the kinetics, the tolerance to load, the inhibitions and the acclimation time. With FOG it is almost mandatory: the 5-8% threshold on VS at which LCFAs start to cause trouble only shows up under continuous feeding.
Operational case: 500 kWe plant with pig slurry
A 500 kWe plant (mesophilic, 38 °C) at an extensive pig operation in Aragón. Original diet: 100% pig slurry. Design OLR: 2.2 kg VS/m³·d.
Initial symptom: historical specific productivity of 0.22 Nm³ CH₄/kg VS fed, well below the theoretical range (0.28-0.32 expected for well-run pig slurry). Monthly episodes of drops to 0.15-0.18 Nm³ CH₄/kg VS with no apparent cause, with spontaneous recovery in 2-3 weeks.
Operational Excellence Diagnosis: three findings
- Average TAN in the digestate of 4,800 mg N/L, with calculated free NH₃ between 280 and 420 mg N/L: a sustained incipient inhibition zone.
- Three of the drop episodes coincided with prophylactic medication campaigns for piglets (tylosin) at the farm, which were not notified to the operator.
- The digester pH swung between 7.8 and 8.3 depending on the week, amplifying the free NH₃ fraction at the high peaks.
Intervention
- Co-digestion with FOG from a nearby abattoir, at 6% on VS. Mixture OLR maintained at 2.8 kg VS/m³·d (a controlled increase of 27%). The management of the sentinel variables is detailed in stabilising the anaerobic digester.
- Notification protocol with the farm: 48 h notice before medication and retention of the batch for 7 days in a secondary pit before transferring it to the digester.
- Weekly monitoring of free NH₃ (previously monthly) and of individual VFAs, focusing on propionic acid.
Result at 6 months
Specific productivity: 0.22 → 0.31 Nm³ CH₄/kg VS fed (+41%).
Free NH₃ stabilised at 180-240 mg N/L (a controlled watch zone).
Zero drop episodes from medication after the notification protocol with the farm.
Annual methane production: +38% on the previous year.
ROI of the intervention: 7 months, including the cost of the FOG and with no cost for the contractual changes with the farm.
Frequently asked questions about slurry biogas
Why does pig slurry inhibit methanogenesis more easily than cattle slurry?
Pig slurry has a total ammonia nitrogen (TAN) concentration between 3,000 and 5,500 mg N/L, while cattle slurry sits between 1,500 and 3,500 mg N/L.
The real inhibiting fraction (free NH₃) scales with TAN according to the pH and temperature of the digester, so pig slurry enters the incipient inhibition zone (> 150 mg N-NH₃/L) at lower operational loads. The biochemical difference lies in the animal diet: pig diets contain more fermentable protein than cattle diets under intensive conditions.
How do veterinary antibiotics affect biogas?
They enter the digester with the slurry during medication periods at the farm and produce selective inhibition of methanogenesis. Tylosin inhibits above 50 mg/L and glutaraldehyde above 100 mg/L.
Below those thresholds the effect is sublethal: it slows the kinetics with no explicit decoupling, producing a drop in productivity that is hard to diagnose without pharmacological traceability of the batch. The intervention is not chemical, it is contractual with the farm of origin.
Which substrates should be co-digested with slurry to stabilise the digester?
The most efficient are maize silage (BMP 290-340 NmL CH₄/g VS) for stability, FOG or fats (600-900) for energy density, and crude glycerine (800-1,000) where there is a stable supply.
The optimal operational ratio for pig slurry is 60-75% slurry by volume with 25-40% co-substrate, adjusting so that the effective OLR stays at 60-80% of the nominal maximum. Above that threshold there is no margin to absorb seasonal variability.
What is the typical BMP of pig slurry?
It sits between 180 and 280 NmL CH₄/g VS fed, with a variability of ±15% depending on the animal diet and the regime of the operation. Cattle slurry has a lower BMP (150-240).
In industrial operation, the real specific productivity is typically 65-80% of the theoretical BMP, conditioned by the digester HRT and the TAN concentration; that real percentage is measured by a semi-continuous test, not by a BMP. Co-digestion with energy substrates can raise the average productivity of the diet by between 35% and 60%.
How do you decide what percentage of FOG the digester can take?
Not with a BMP. FOG has an extremely high BMP (600-900 NmL CH₄/g VS) precisely because in batch mode, with a single load and excess inoculum, long-chain fatty acids barely cause a problem. In the real digester, fed every day, those LCFAs accumulate and slow down syntrophic β-oxidation.
The way to find the threshold (that 5-8% on VS that makes the difference) is a semi-continuous test: a laboratory reactor is fed for several weeks while raising the FOG fraction, and you watch for when propionic acid starts to rise. It costs a fraction of what it costs to find out at plant scale.
Does your slurry biogas plant have dips that come and go with no apparent cause?
It is probably not unpredictable biology: it is probably absent pharmacological traceability or free NH₃ out of control. Request an Operational Excellence Diagnosis and we will audit the three structural causes of livestock biogas.
Normative and bibliographic references
Hansen, K.H. et al. (1998). Anaerobic digestion of swine manure: inhibition by ammonia. Water Research, 32 (1), 5-12. → doi.org/10.1016/S0043-1354(97)00201-7
Massé, D.I. et al. (2011). Potential of biological processes to treat antibiotics. Animal Feed Science and Technology, 166, 436-445.
Spielmeyer, A. (2018). Occurrence and fate of antibiotics in manure during digestion. Chemosphere, 210, 1056-1070.
Rajagopal, R. et al. (2013). A critical review on inhibition of anaerobic digestion. Bioresource Technology, 143, 632-641.